


23 Nelson Yengue

-
- Height:
- 6-3
-
- Weight:
- 188
-
- Year:
- 5
-
- Hometown:
- Yaoundé, Cameroon
-
- Position:
- Shooting Guard
-
- Major:
- Economics
-
- gp
- 23
-
- pts/g
- 15.5
-
- fg %
- 54.1
-
- 3pt %
- 27.8
-
- ft %
- 68.6
-
- reb/g
- 6.9
-
- a/g
- 2.3
Player Profile
| Overall | Conf | |||
|---|---|---|---|---|
| Games | 23 | 23 | ||
| Games started | 23 | 23 | ||
| Minutes | 686 | 686 | ||
| Minutes per game | 29.8 | 29.8 | ||
| FG | 152-281 | 152-281 | ||
| FG Pct | 54.1 | 54.1 | ||
| 3PT | 5-18 | 5-18 | ||
| 3PT Pct | 27.8 | 27.8 | ||
| FT | 48-70 | 48-70 | ||
| FT Pct | 68.6 | 68.6 | ||
| Off rebounds | 64 | 64 | ||
| Def rebounds | 95 | 95 | ||
| Total rebounds | 159 | 159 | ||
| Rebounds per game | 6.9 | 6.9 | ||
| Personal fouls | 68 | 68 | ||
| Disqualifications | 4 | 4 | ||
| Assists | 52 | 52 | ||
| Turnovers | 41 | 41 | ||
| Assist to turnover ratio | 1.3 | 1.3 | ||
| Steals | 12 | 12 | ||
| Blocks | 15 | 15 | ||
| Points | 357 | 357 | ||
| Points per game | 15.5 | 15.5 | ||
| Points per 40 min | 20.8 | 20.8 | ||
Game Log - Shooting
| Date | Opponent | Score | gs | min | fg | pct | 3pt | pct | ft | pct | pts |
|---|---|---|---|---|---|---|---|---|---|---|---|
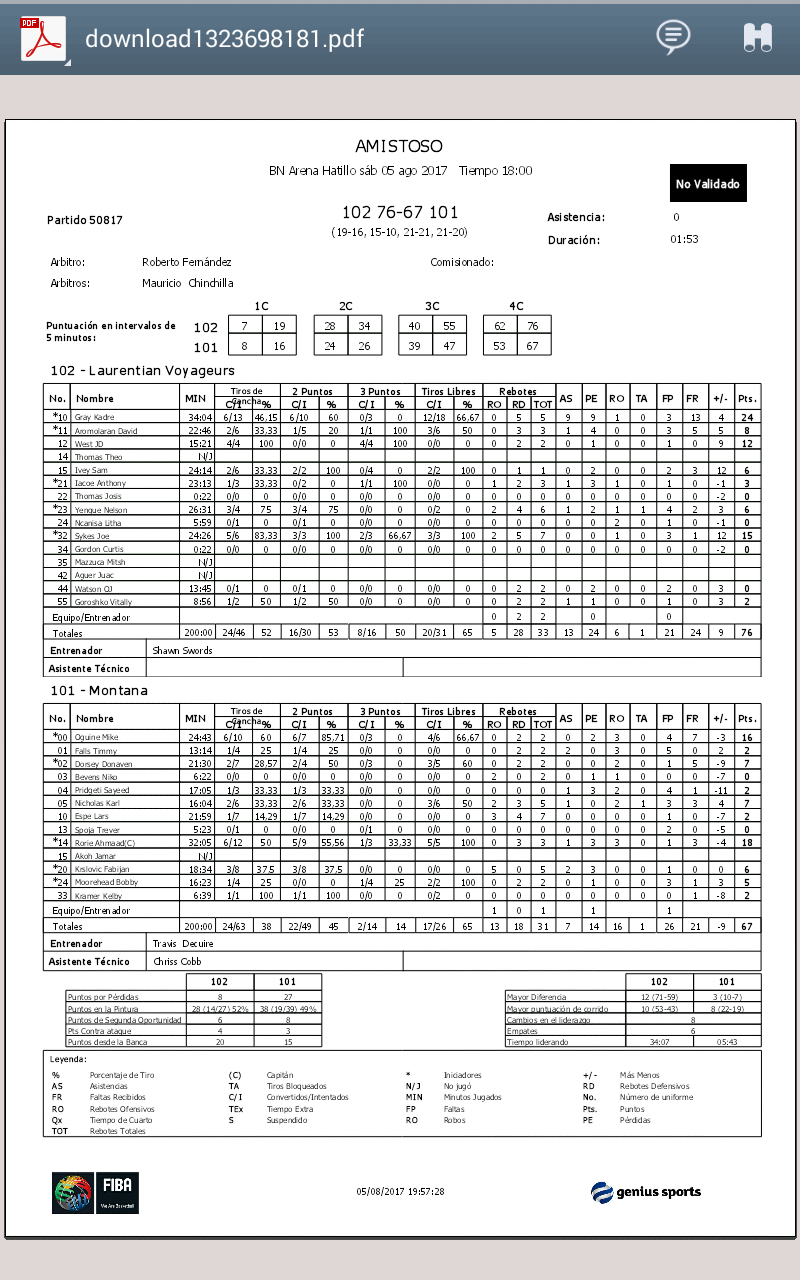
| Aug 5 | vs. Montana | W, 76-67 | - | - | - | - | - | - | - | - | - |
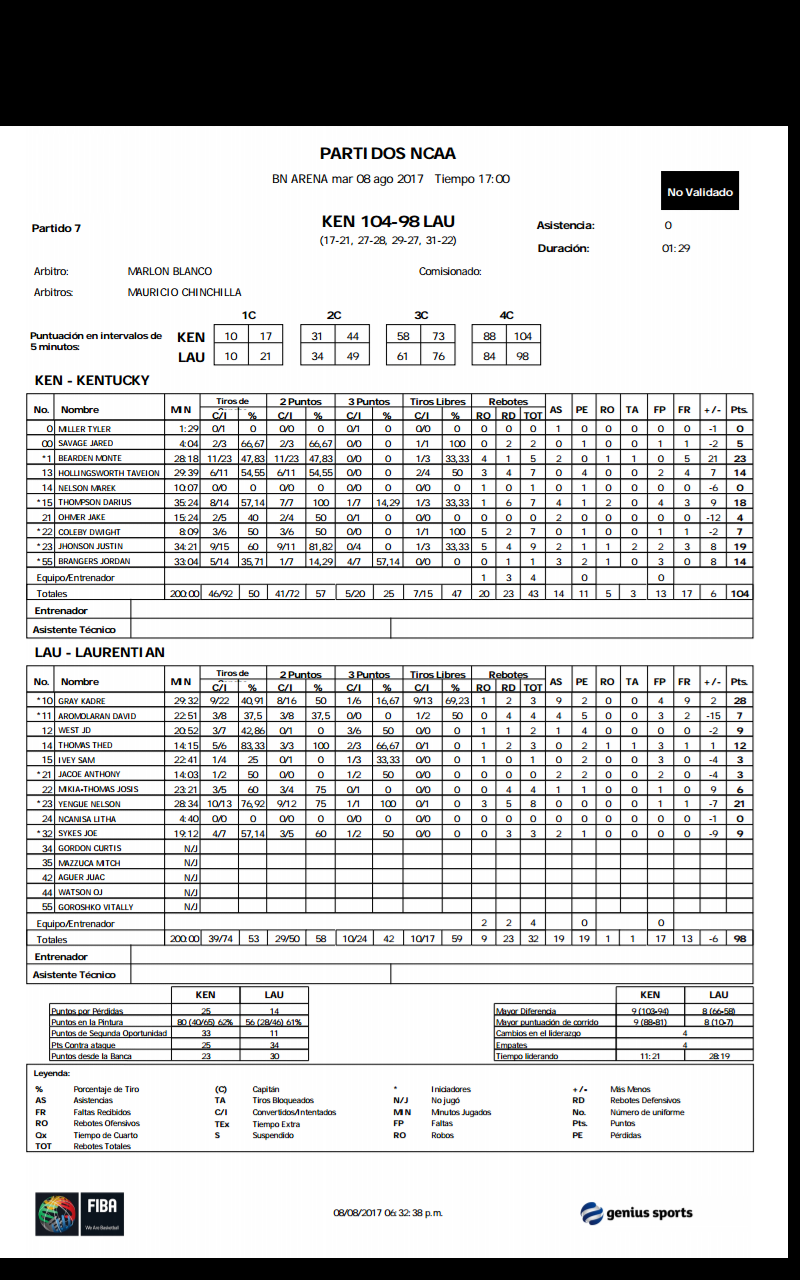
| Aug 8 | vs. Western Ky. | L, 104-98 | - | - | - | - | - | - | - | - | - |
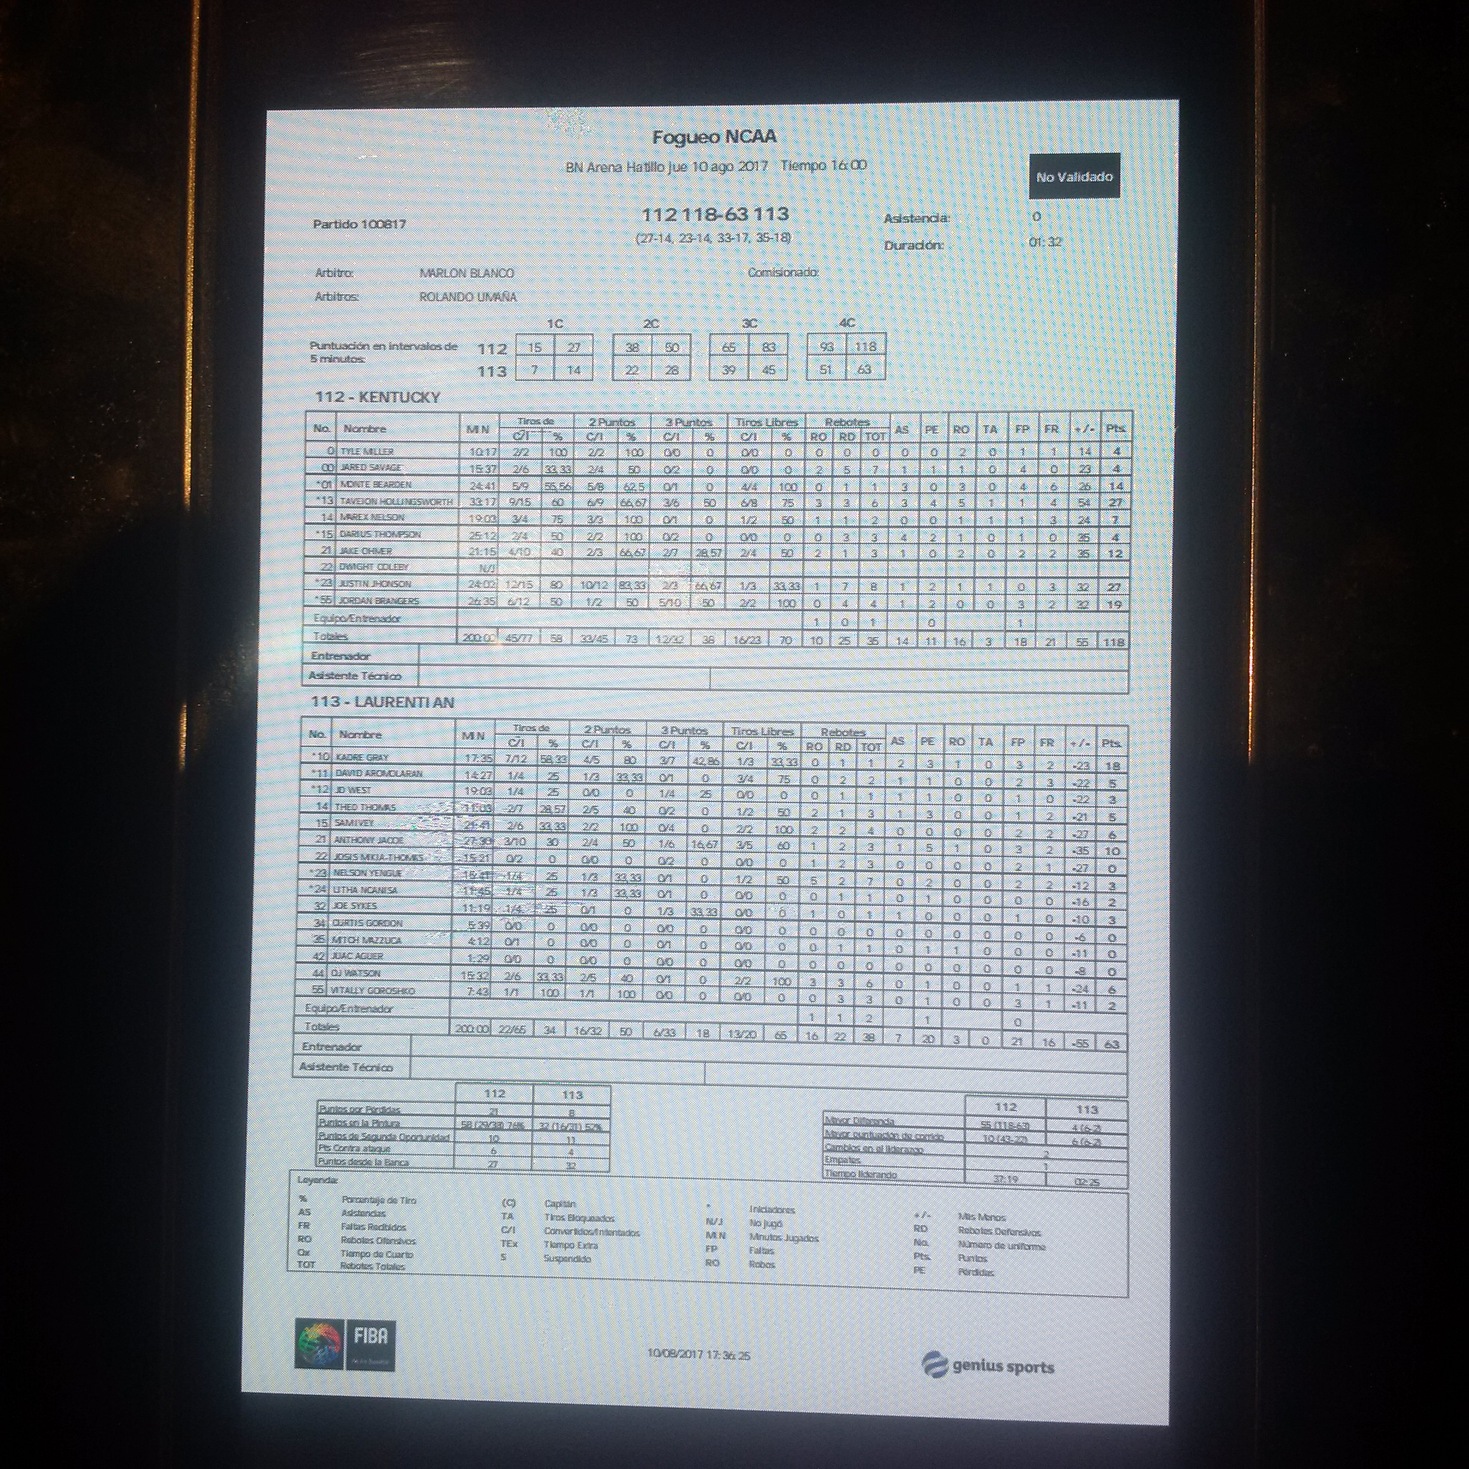
| Aug 10 | vs. Western Ky. | L, 118-63 | - | - | - | - | - | - | - | - | - |
| Aug 12 | vs. Kent St. | L, 83-82 | - | - | - | - | - | - | - | - | - |
| Sep 22 | Algoma | W, 76-68 | - | 21 | 2-3 | 66.7 | 0-0 | - | 1-1 | 100.0 | 5 |
| Oct 5 | at Brandon | W, 92-79 | 1 | 20 | 6-8 | 75.0 | 0-0 | - | 2-2 | 100.0 | 14 |
| Oct 6 | at Winnipeg | W, 87-81 | 1 | 27 | 3-6 | 50.0 | 0-0 | - | 0-0 | - | 6 |
| Oct 7 | at Manitoba | W, 87-80 | 1 | 25 | 3-9 | 33.3 | 0-0 | - | 1-1 | 100.0 | 7 |
| Nov 3 | Waterloo | W, 96-80 | 1 | 24 | 7-13 | 53.8 | 0-0 | - | 1-1 | 100.0 | 15 |
| Nov 4 | Laurier | W, 106-89 | 1 | 27 | 8-8 | 100.0 | 0-0 | - | 3-3 | 100.0 | 19 |
| Nov 10 | at Lakehead | W, 82-61 | 1 | 21 | 4-9 | 44.4 | 0-0 | - | 0-0 | - | 8 |
| Nov 17 | at McMaster | W, 89-67 | 1 | 36 | 14-21 | 66.7 | 0-2 | 0.0 | 4-4 | 100.0 | 32 |
| Nov 18 | at Brock | L, 71-55 | 1 | 36 | 3-11 | 27.3 | 0-1 | 0.0 | 1-2 | 50.0 | 7 |
| Nov 24 | Guelph | W, 84-71 | 1 | 36 | 9-17 | 52.9 | 0-1 | 0.0 | 4-4 | 100.0 | 22 |
| Nov 25 | Algoma | W, 96-86 | 1 | 33 | 8-11 | 72.7 | 0-0 | - | 2-2 | 100.0 | 18 |
| Dec 1 | at Western | W, 80-74 | 1 | 33 | 5-7 | 71.4 | 0-0 | - | 3-4 | 75.0 | 13 |
| Dec 2 | at Windsor | W, 90-63 | 1 | 18 | 5-11 | 45.5 | 1-4 | 25.0 | 0-0 | - | 11 |
| Jan 5 | York | W, 92-53 | 1 | 20 | 7-8 | 87.5 | 0-0 | - | 0-0 | - | 14 |
| Jan 6 | Queen's | W, 71-70 | 1 | 34 | 7-19 | 36.8 | 0-0 | - | 1-4 | 25.0 | 15 |
| Jan 12 | Ryerson | W, 88-83 | 1 | 30 | 6-8 | 75.0 | 1-1 | 100.0 | 5-6 | 83.3 | 18 |
| Jan 13 | Toronto | W, 101-82 | 1 | 21 | 4-6 | 66.7 | 0-0 | - | 0-0 | - | 8 |
| Jan 19 | at Carleton | L, 71-67 | 1 | 27 | 7-16 | 43.8 | 1-3 | 33.3 | 1-1 | 100.0 | 16 |
| Jan 20 | at Ottawa | W, 79-71 | 1 | 35 | 10-14 | 71.4 | 0-0 | - | 7-8 | 87.5 | 27 |
| Jan 26 | at Queen's | W, 89-69 | 1 | 30 | 8-15 | 53.3 | 1-1 | 100.0 | 0-0 | - | 17 |
| Jan 27 | at York | W, 89-80 | 1 | 30 | 5-12 | 41.7 | 0-0 | - | 6-8 | 75.0 | 16 |
| Jan 31 | at Nipissing | W, 82-72 | 1 | 36 | 9-20 | 45.0 | 0-0 | - | 0-0 | - | 18 |
| Feb 3 | Nipissing | L, 101-96 | 1 | 28 | 3-7 | 42.9 | 0-0 | - | 0-2 | 0.0 | 6 |
| Feb 9 | Ottawa | L, 99-90 | 1 | 35 | 8-13 | 61.5 | 0-1 | 0.0 | 0-0 | - | 16 |
| Feb 10 | Carleton | L, 101-60 | 1 | 26 | 3-10 | 30.0 | 0-1 | 0.0 | 1-6 | 16.7 | 7 |
| Feb 16 | at Toronto | L, 80-77 | 1 | 30 | 6-10 | 60.0 | 0-0 | - | 3-6 | 50.0 | 15 |
| Feb 17 | at Ryerson | L, 76-74 | 1 | 40 | 6-15 | 40.0 | 1-3 | 33.3 | 6-9 | 66.7 | 19 |
Game Log - Ball control
| Date | Opponent | Score | gs | min | off | def | reb | ast | to | a/to | stl | blk | pf | dq |
|---|---|---|---|---|---|---|---|---|---|---|---|---|---|---|
| Aug 5 | vs. Montana | W, 76-67 | - | - | - | - | - | - | - | - | - | - | - | - |
| Aug 8 | vs. Western Ky. | L, 104-98 | - | - | - | - | - | - | - | - | - | - | - | - |
| Aug 10 | vs. Western Ky. | L, 118-63 | - | - | - | - | - | - | - | - | - | - | - | - |
| Aug 12 | vs. Kent St. | L, 83-82 | - | - | - | - | - | - | - | - | - | - | - | - |
| Sep 22 | Algoma | W, 76-68 | - | 21 | 1 | 2 | 3 | 0 | 0 | - | 0 | 0 | 2 | 0 |
| Oct 5 | at Brandon | W, 92-79 | 1 | 20 | 2 | 0 | 2 | 0 | 1 | 0.0 | 3 | 0 | 2 | 0 |
| Oct 6 | at Winnipeg | W, 87-81 | 1 | 27 | 1 | 2 | 3 | 8 | 2 | 4.0 | 4 | 0 | 3 | - |
| Oct 7 | at Manitoba | W, 87-80 | 1 | 25 | 7 | 5 | 12 | 1 | 1 | 1.0 | 0 | 0 | 3 | - |
| Nov 3 | Waterloo | W, 96-80 | 1 | 24 | 3 | 2 | 5 | 1 | 0 | - | 0 | 0 | 5 | 1 |
| Nov 4 | Laurier | W, 106-89 | 1 | 27 | 1 | 6 | 7 | 2 | 2 | 1.0 | 2 | 0 | 4 | 0 |
| Nov 10 | at Lakehead | W, 82-61 | 1 | 21 | 0 | 1 | 1 | 1 | 1 | 1.0 | 1 | 0 | 4 | 0 |
| Nov 17 | at McMaster | W, 89-67 | 1 | 36 | 3 | 5 | 8 | 3 | 4 | 0.8 | 1 | 1 | 1 | - |
| Nov 18 | at Brock | L, 71-55 | 1 | 36 | 3 | 3 | 6 | 1 | 3 | 0.3 | 0 | 1 | 2 | 0 |
| Nov 24 | Guelph | W, 84-71 | 1 | 36 | 3 | 9 | 12 | 3 | 0 | - | 1 | 1 | 2 | 0 |
| Nov 25 | Algoma | W, 96-86 | 1 | 33 | 4 | 2 | 6 | 1 | 1 | 1.0 | 1 | 0 | 2 | 0 |
| Dec 1 | at Western | W, 80-74 | 1 | 33 | 1 | 5 | 6 | 0 | 2 | 0.0 | 1 | 0 | 4 | 0 |
| Dec 2 | at Windsor | W, 90-63 | 1 | 18 | 2 | 3 | 5 | 1 | 0 | - | 0 | 1 | 0 | 0 |
| Jan 5 | York | W, 92-53 | 1 | 20 | 3 | 3 | 6 | 4 | 1 | 4.0 | 0 | 1 | 1 | 0 |
| Jan 6 | Queen's | W, 71-70 | 1 | 34 | 6 | 4 | 10 | 6 | 1 | 6.0 | 1 | 0 | 2 | 0 |
| Jan 12 | Ryerson | W, 88-83 | 1 | 30 | 4 | 8 | 12 | 3 | 2 | 1.5 | 1 | 1 | 5 | 1 |
| Jan 13 | Toronto | W, 101-82 | 1 | 21 | 0 | 2 | 2 | 2 | 1 | 2.0 | 0 | 1 | 3 | 0 |
| Jan 19 | at Carleton | L, 71-67 | 1 | 27 | 2 | 8 | 10 | 1 | 0 | - | 0 | 2 | 3 | 0 |
| Jan 20 | at Ottawa | W, 79-71 | 1 | 35 | 3 | 2 | 5 | 2 | 6 | 0.3 | 1 | 0 | 5 | 1 |
| Jan 26 | at Queen's | W, 89-69 | 1 | 30 | 3 | 6 | 9 | 0 | 1 | 0.0 | 0 | 0 | 2 | - |
| Jan 27 | at York | W, 89-80 | 1 | 30 | 6 | 5 | 11 | 0 | 2 | 0.0 | 0 | 1 | 3 | 0 |
| Jan 31 | at Nipissing | W, 82-72 | 1 | 36 | 7 | 2 | 9 | 3 | 0 | - | 2 | 2 | 2 | 0 |
| Feb 3 | Nipissing | L, 101-96 | 1 | 28 | 2 | 3 | 5 | 3 | 0 | - | 0 | 1 | 4 | 0 |
| Feb 9 | Ottawa | L, 99-90 | 1 | 35 | 0 | 2 | 2 | 1 | 1 | 1.0 | 0 | 1 | 3 | 0 |
| Feb 10 | Carleton | L, 101-60 | 1 | 26 | 3 | 3 | 6 | 3 | 4 | 0.8 | 0 | 1 | 3 | 0 |
| Feb 16 | at Toronto | L, 80-77 | 1 | 30 | 2 | 5 | 7 | 3 | 3 | 1.0 | 0 | 0 | 5 | 1 |
| Feb 17 | at Ryerson | L, 76-74 | 1 | 40 | 3 | 6 | 9 | 8 | 6 | 1.3 | 0 | 0 | 3 | 0 |
Career Stats - Shooting per game
| gp | gs | min/g | fg/g | pct | 3pt/g | pct | ft/g | pct | ppg | |
|---|---|---|---|---|---|---|---|---|---|---|
| 2011-12 | 20 | 3 | 17.6 | 2.0-4.3 | 46.5 | 0.0-0.2 | 0.0 | 0.8-1.1 | 68.2 | 4.8 |
| 2012-13 | 19 | 18 | 24.4 | 3.8-6.6 | 58.4 | 0.0-0.0 | - | 1.6-2.3 | 69.8 | 9.3 |
| 2013-14 | 14 | 12 | 29.1 | 5.6-10.7 | 52.0 | 0.0-0.1 | 0.0 | 3.2-4.6 | 69.2 | 14.4 |
| 2014-15 | - | - | - | 0.0-0.0 | - | 0.0-0.0 | - | 0.0-0.0 | - | - |
| 2016-17 | 19 | 17 | 29.1 | 4.9-9.3 | 53.4 | 0.2-0.4 | 42.9 | 1.2-1.7 | 66.7 | 11.2 |
| 2017-18 | 23 | 23 | 29.8 | 6.6-12.2 | 54.1 | 0.2-0.8 | 27.8 | 2.1-3.0 | 68.6 | 15.5 |
| Total | 95 | 73 | 25.9 | 4.6-8.6 | 53.4 | 0.1-0.3 | 25.8 | 1.7-2.5 | 68.7 | 11.0 |
Career Stats - Shooting totals
| gp | gs | min | fg | pct | 3pt | pct | ft | pct | pts | |
|---|---|---|---|---|---|---|---|---|---|---|
| 2011-12 | 20 | 3 | 352 | 40-86 | 46.5 | 0-5 | 0.0 | 15-22 | 68.2 | 95 |
| 2012-13 | 19 | 18 | 464 | 73-125 | 58.4 | 0-0 | - | 30-43 | 69.8 | 176 |
| 2013-14 | 14 | 12 | 408 | 78-150 | 52.0 | 0-1 | 0.0 | 45-65 | 69.2 | 201 |
| 2014-15 | - | - | - | 0-0 | - | 0-0 | - | 0-0 | - | 0 |
| 2016-17 | 19 | 17 | 553 | 94-176 | 53.4 | 3-7 | 42.9 | 22-33 | 66.7 | 213 |
| 2017-18 | 23 | 23 | 686 | 152-281 | 54.1 | 5-18 | 27.8 | 48-70 | 68.6 | 357 |
| Total | 95 | 73 | 2463 | 437-818 | 53.4 | 8-31 | 25.8 | 160-233 | 68.7 | 1042 |
Career Stats - Shooting per 40 min
| gp | gs | min/g | fg/40 | pct | 3pt/40 | pct | ft/40 | pct | pts/40 | |
|---|---|---|---|---|---|---|---|---|---|---|
| 2011-12 | 20 | 3 | 17.6 | 4.5-9.8 | 46.5 | 0.0-0.6 | 0.0 | 1.7-2.5 | 68.2 | 10.8 |
| 2012-13 | 19 | 18 | 24.4 | 6.3-10.8 | 58.4 | 0.0-0.0 | - | 2.6-3.7 | 69.8 | 15.2 |
| 2013-14 | 14 | 12 | 29.1 | 7.6-14.7 | 52.0 | 0.0-0.1 | 0.0 | 4.4-6.4 | 69.2 | 19.7 |
| 2014-15 | - | - | - | 0.0-0.0 | - | 0.0-0.0 | - | 0.0-0.0 | - | - |
| 2016-17 | 19 | 17 | 29.1 | 6.8-12.7 | 53.4 | 0.2-0.5 | 42.9 | 1.6-2.4 | 66.7 | 15.4 |
| 2017-18 | 23 | 23 | 29.8 | 8.9-16.4 | 54.1 | 0.3-1.0 | 27.8 | 2.8-4.1 | 68.6 | 20.8 |
| Total | 95 | 73 | 25.9 | 7.1-13.3 | 53.4 | 0.1-0.5 | 25.8 | 2.6-3.8 | 68.7 | 16.9 |
Career Stats - Ball control per game
| gp | gs | mpg | off/g | def/g | reb/g | pf/g | dq/g | ast/g | to/g | a/to | stl/g | blk/g | |
|---|---|---|---|---|---|---|---|---|---|---|---|---|---|
| 2011-12 | 20 | 3 | 17.6 | 2.0 | 1.9 | 3.9 | 2.6 | 0.1 | 0.6 | 0.6 | 1.0 | 0.6 | 0.6 |
| 2012-13 | 19 | 18 | 24.4 | 2.3 | 2.3 | 4.6 | 2.3 | 0.1 | 0.8 | 1.3 | 0.6 | 0.8 | 1.2 |
| 2013-14 | 14 | 12 | 29.1 | 2.3 | 4.4 | 6.6 | 3.1 | 0.3 | 1.6 | 2.3 | 0.7 | 1.1 | 1.4 |
| 2014-15 | - | - | - | - | - | - | - | - | - | - | - | - | - |
| 2016-17 | 19 | 17 | 29.1 | 2.7 | 4.7 | 7.4 | 3.4 | 0.4 | 1.5 | 1.6 | 0.9 | 1.4 | 1.4 |
| 2017-18 | 23 | 23 | 29.8 | 2.8 | 4.1 | 6.9 | 3.0 | 0.2 | 2.3 | 1.8 | 1.3 | 0.5 | 0.7 |
| Total | 95 | 73 | 25.9 | 2.4 | 3.4 | 5.9 | 2.9 | 0.2 | 1.4 | 1.5 | 0.9 | 0.8 | 1.0 |
Career Stats - Ball control totals
| gp | gs | min | off | def | reb | pf | dq | ast | to | a/to | stl | blk | |
|---|---|---|---|---|---|---|---|---|---|---|---|---|---|
| 2011-12 | 20 | 3 | 352 | 41 | 37 | 78 | 53 | 3 | 12 | 12 | 1.0 | 11 | 11 |
| 2012-13 | 19 | 18 | 464 | 43 | 44 | 87 | 43 | 1 | 16 | 25 | 0.6 | 15 | 22 |
| 2013-14 | 14 | 12 | 408 | 32 | 61 | 93 | 44 | 4 | 23 | 32 | 0.7 | 15 | 20 |
| 2014-15 | - | - | - | - | - | - | - | - | - | - | - | - | - |
| 2016-17 | 19 | 17 | 553 | 52 | 89 | 141 | 65 | 7 | 28 | 31 | 0.9 | 26 | 27 |
| 2017-18 | 23 | 23 | 686 | 64 | 95 | 159 | 68 | 4 | 52 | 41 | 1.3 | 12 | 15 |
| Total | 95 | 73 | 2463 | 232 | 326 | 558 | 273 | 19 | 131 | 141 | 0.9 | 79 | 95 |
Career Stats - Ball control per 40 min
| gp | gs | mpg | off/40 | def/40 | reb/40 | pf/40 | dq/40 | ast/40 | to/40 | a/to | stl/40 | blk/40 | |
|---|---|---|---|---|---|---|---|---|---|---|---|---|---|
| 2011-12 | 20 | 3 | 17.6 | 4.7 | 4.2 | 8.9 | 6.0 | 0.3 | 1.4 | 1.4 | 1.0 | 1.3 | 1.3 |
| 2012-13 | 19 | 18 | 24.4 | 3.7 | 3.8 | 7.5 | 3.7 | 0.1 | 1.4 | 2.2 | 0.6 | 1.3 | 1.9 |
| 2013-14 | 14 | 12 | 29.1 | 3.1 | 6.0 | 9.1 | 4.3 | 0.4 | 2.3 | 3.1 | 0.7 | 1.5 | 2.0 |
| 2014-15 | - | - | - | - | - | - | - | - | - | - | - | - | - |
| 2016-17 | 19 | 17 | 29.1 | 3.8 | 6.4 | 10.2 | 4.7 | 0.5 | 2.0 | 2.2 | 0.9 | 1.9 | 2.0 |
| 2017-18 | 23 | 23 | 29.8 | 3.7 | 5.5 | 9.3 | 4.0 | 0.2 | 3.0 | 2.4 | 1.3 | 0.7 | 0.9 |
| Total | 95 | 73 | 25.9 | 3.8 | 5.3 | 9.1 | 4.4 | 0.3 | 2.1 | 2.3 | 0.9 | 1.3 | 1.5 |
Splits Stats - Shooting per game
| gp | gs | min/g | fg/g | pct | 3pt/g | pct | ft/g | pct | ppg | ||
|---|---|---|---|---|---|---|---|---|---|---|---|
| Event | Total | 23 | 23 | 29.8 | 6.6-12.2 | 54.1 | 0.2-0.8 | 27.8 | 2.1-3.0 | 68.6 | 15.5 |
| Conference | 23 | 23 | 29.8 | 6.6-12.2 | 54.1 | 0.2-0.8 | 27.8 | 2.1-3.0 | 68.6 | 15.5 | |
| Exhibition | 4 | 3 | 23.3 | 3.5-6.5 | 53.8 | 0.0-0.0 | - | 1.0-1.0 | 100.0 | 8.0 | |
| Location | Home | 11 | 11 | 28.5 | 6.4-10.9 | 58.3 | 0.1-0.4 | 25.0 | 1.5-2.5 | 60.7 | 14.4 |
| Away | 12 | 12 | 31.0 | 6.8-13.4 | 50.9 | 0.3-1.2 | 28.6 | 2.6-3.5 | 73.8 | 16.6 | |
| Neutral | - | - | - | 0.0-0.0 | - | 0.0-0.0 | - | 0.0-0.0 | - | - | |
| Result | Wins | 16 | 16 | 29.0 | 7.2-12.4 | 58.3 | 0.2-0.6 | 33.3 | 2.2-2.8 | 81.8 | 16.9 |
| Losses | 7 | 7 | 31.7 | 5.1-11.7 | 43.9 | 0.3-1.3 | 22.2 | 1.7-3.7 | 46.2 | 12.3 | |
| Month | November | 7 | 7 | 30.4 | 7.6-12.9 | 58.9 | 0.0-0.6 | 0.0 | 2.1-2.3 | 93.8 | 17.3 |
| December | 2 | 2 | 25.5 | 5.0-9.0 | 55.6 | 0.5-2.0 | 25.0 | 1.5-2.0 | 75.0 | 12.0 | |
| January | 9 | 9 | 29.2 | 7.0-13.1 | 53.4 | 0.3-0.6 | 60.0 | 2.2-3.0 | 74.1 | 16.6 | |
| February | 5 | 5 | 31.8 | 5.2-11.0 | 47.3 | 0.2-1.0 | 20.0 | 2.0-4.6 | 43.5 | 12.6 |
Splits Stats - Shooting totals
| gp | gs | min | fg | pct | 3pt | pct | ft | pct | pts | ||
|---|---|---|---|---|---|---|---|---|---|---|---|
| Event | Total | 23 | 23 | 686 | 152-281 | 54.1 | 5-18 | 27.8 | 48-70 | 68.6 | 357 |
| Conference | 23 | 23 | 686 | 152-281 | 54.1 | 5-18 | 27.8 | 48-70 | 68.6 | 357 | |
| Exhibition | 4 | 3 | 93 | 14-26 | 53.8 | 0-0 | - | 4-4 | 100.0 | 32 | |
| Location | Home | 11 | 11 | 314 | 70-120 | 58.3 | 1-4 | 25.0 | 17-28 | 60.7 | 158 |
| Away | 12 | 12 | 372 | 82-161 | 50.9 | 4-14 | 28.6 | 31-42 | 73.8 | 199 | |
| Neutral | - | - | - | 0-0 | - | 0-0 | - | 0-0 | - | 0 | |
| Result | Wins | 16 | 16 | 464 | 116-199 | 58.3 | 3-9 | 33.3 | 36-44 | 81.8 | 271 |
| Losses | 7 | 7 | 222 | 36-82 | 43.9 | 2-9 | 22.2 | 12-26 | 46.2 | 86 | |
| Month | November | 7 | 7 | 213 | 53-90 | 58.9 | 0-4 | 0.0 | 15-16 | 93.8 | 121 |
| December | 2 | 2 | 51 | 10-18 | 55.6 | 1-4 | 25.0 | 3-4 | 75.0 | 24 | |
| January | 9 | 9 | 263 | 63-118 | 53.4 | 3-5 | 60.0 | 20-27 | 74.1 | 149 | |
| February | 5 | 5 | 159 | 26-55 | 47.3 | 1-5 | 20.0 | 10-23 | 43.5 | 63 |
Splits Stats - Shooting per 40 min
| gp | gs | min/g | fg/40 | pct | 3pt/40 | pct | ft/40 | pct | pts/40 | ||
|---|---|---|---|---|---|---|---|---|---|---|---|
| Event | Total | 23 | 23 | 29.8 | 8.9-16.4 | 54.1 | 0.3-1.0 | 27.8 | 2.8-4.1 | 68.6 | 20.8 |
| Conference | 23 | 23 | 29.8 | 8.9-16.4 | 54.1 | 0.3-1.0 | 27.8 | 2.8-4.1 | 68.6 | 20.8 | |
| Exhibition | 4 | 3 | 23.3 | 6.0-11.2 | 53.8 | 0.0-0.0 | - | 1.7-1.7 | 100.0 | 13.8 | |
| Location | Home | 11 | 11 | 28.5 | 8.9-15.3 | 58.3 | 0.1-0.5 | 25.0 | 2.2-3.6 | 60.7 | 20.1 |
| Away | 12 | 12 | 31.0 | 8.8-17.3 | 50.9 | 0.4-1.5 | 28.6 | 3.3-4.5 | 73.8 | 21.4 | |
| Neutral | - | - | - | 0.0-0.0 | - | 0.0-0.0 | - | 0.0-0.0 | - | - | |
| Result | Wins | 16 | 16 | 29.0 | 10.0-17.2 | 58.3 | 0.3-0.8 | 33.3 | 3.1-3.8 | 81.8 | 23.4 |
| Losses | 7 | 7 | 31.7 | 6.5-14.8 | 43.9 | 0.4-1.6 | 22.2 | 2.2-4.7 | 46.2 | 15.5 | |
| Month | November | 7 | 7 | 30.4 | 10.0-16.9 | 58.9 | 0.0-0.8 | 0.0 | 2.8-3.0 | 93.8 | 22.7 |
| December | 2 | 2 | 25.5 | 7.8-14.1 | 55.6 | 0.8-3.1 | 25.0 | 2.4-3.1 | 75.0 | 18.8 | |
| January | 9 | 9 | 29.2 | 9.6-17.9 | 53.4 | 0.5-0.8 | 60.0 | 3.0-4.1 | 74.1 | 22.7 | |
| February | 5 | 5 | 31.8 | 6.5-13.8 | 47.3 | 0.3-1.3 | 20.0 | 2.5-5.8 | 43.5 | 15.8 |
Splits Stats - Ball control per game
| gp | gs | mpg | off/g | def/g | reb/g | pf/g | dq/g | ast/g | to/g | a/to | stl/g | blk/g | ||
|---|---|---|---|---|---|---|---|---|---|---|---|---|---|---|
| Event | Total | 23 | 23 | 29.8 | 2.8 | 4.1 | 6.9 | 3.0 | 0.2 | 2.3 | 1.8 | 1.3 | 0.5 | 0.7 |
| Conference | 23 | 23 | 29.8 | 2.8 | 4.1 | 6.9 | 3.0 | 0.2 | 2.3 | 1.8 | 1.3 | 0.5 | 0.7 | |
| Exhibition | 4 | 3 | 23.3 | 2.8 | 2.3 | 5.0 | 2.5 | 0.0 | 2.3 | 1.0 | 2.3 | 1.8 | 0.0 | |
| Location | Home | 11 | 11 | 28.5 | 2.6 | 4.0 | 6.6 | 3.1 | 0.2 | 2.6 | 1.2 | 2.2 | 0.5 | 0.6 |
| Away | 12 | 12 | 31.0 | 2.9 | 4.3 | 7.2 | 2.8 | 0.2 | 1.9 | 2.3 | 0.8 | 0.5 | 0.7 | |
| Neutral | - | - | - | - | - | - | - | - | - | - | - | - | - | |
| Result | Wins | 16 | 16 | 29.0 | 3.1 | 4.1 | 7.1 | 2.8 | 0.2 | 2.0 | 1.5 | 1.3 | 0.8 | 0.6 |
| Losses | 7 | 7 | 31.7 | 2.1 | 4.3 | 6.4 | 3.3 | 0.1 | 2.9 | 2.4 | 1.2 | 0.0 | 0.9 | |
| Month | November | 7 | 7 | 30.4 | 2.4 | 4.0 | 6.4 | 2.9 | 0.1 | 1.7 | 1.6 | 1.1 | 0.9 | 0.4 |
| December | 2 | 2 | 25.5 | 1.5 | 4.0 | 5.5 | 2.0 | 0.0 | 0.5 | 1.0 | 0.5 | 0.5 | 0.5 | |
| January | 9 | 9 | 29.2 | 3.8 | 4.4 | 8.2 | 2.9 | 0.2 | 2.3 | 1.6 | 1.5 | 0.6 | 0.9 | |
| February | 5 | 5 | 31.8 | 2.0 | 3.8 | 5.8 | 3.6 | 0.2 | 3.6 | 2.8 | 1.3 | 0.0 | 0.6 |
Splits Stats - Ball control totals
| gp | gs | min | off | def | reb | pf | dq | ast | to | a/to | stl | blk | ||
|---|---|---|---|---|---|---|---|---|---|---|---|---|---|---|
| Event | Total | 23 | 23 | 686 | 64 | 95 | 159 | 68 | 4 | 52 | 41 | 1.3 | 12 | 15 |
| Conference | 23 | 23 | 686 | 64 | 95 | 159 | 68 | 4 | 52 | 41 | 1.3 | 12 | 15 | |
| Exhibition | 4 | 3 | 93 | 11 | 9 | 20 | 10 | 0 | 9 | 4 | 2.3 | 7 | 0 | |
| Location | Home | 11 | 11 | 314 | 29 | 44 | 73 | 34 | 2 | 29 | 13 | 2.2 | 6 | 7 |
| Away | 12 | 12 | 372 | 35 | 51 | 86 | 34 | 2 | 23 | 28 | 0.8 | 6 | 8 | |
| Neutral | - | - | - | - | - | - | - | - | - | - | - | - | - | |
| Result | Wins | 16 | 16 | 464 | 49 | 65 | 114 | 45 | 3 | 32 | 24 | 1.3 | 12 | 9 |
| Losses | 7 | 7 | 222 | 15 | 30 | 45 | 23 | 1 | 20 | 17 | 1.2 | 0 | 6 | |
| Month | November | 7 | 7 | 213 | 17 | 28 | 45 | 20 | 1 | 12 | 11 | 1.1 | 6 | 3 |
| December | 2 | 2 | 51 | 3 | 8 | 11 | 4 | 0 | 1 | 2 | 0.5 | 1 | 1 | |
| January | 9 | 9 | 263 | 34 | 40 | 74 | 26 | 2 | 21 | 14 | 1.5 | 5 | 8 | |
| February | 5 | 5 | 159 | 10 | 19 | 29 | 18 | 1 | 18 | 14 | 1.3 | 0 | 3 |
Splits Stats - Ball control per 40 min
| gp | gs | mpg | off/40 | def/40 | reb/40 | pf/40 | dq/40 | ast/40 | to/40 | a/to | stl/40 | blk/40 | ||
|---|---|---|---|---|---|---|---|---|---|---|---|---|---|---|
| Event | Total | 23 | 23 | 29.8 | 3.7 | 5.5 | 9.3 | 4.0 | 0.2 | 3.0 | 2.4 | 1.3 | 0.7 | 0.9 |
| Conference | 23 | 23 | 29.8 | 3.7 | 5.5 | 9.3 | 4.0 | 0.2 | 3.0 | 2.4 | 1.3 | 0.7 | 0.9 | |
| Exhibition | 4 | 3 | 23.3 | 4.7 | 3.9 | 8.6 | 4.3 | 0.0 | 3.9 | 1.7 | 2.3 | 3.0 | 0.0 | |
| Location | Home | 11 | 11 | 28.5 | 3.7 | 5.6 | 9.3 | 4.3 | 0.3 | 3.7 | 1.7 | 2.2 | 0.8 | 0.9 |
| Away | 12 | 12 | 31.0 | 3.8 | 5.5 | 9.2 | 3.7 | 0.2 | 2.5 | 3.0 | 0.8 | 0.6 | 0.9 | |
| Neutral | - | - | - | - | - | - | - | - | - | - | - | - | - | |
| Result | Wins | 16 | 16 | 29.0 | 4.2 | 5.6 | 9.8 | 3.9 | 0.3 | 2.8 | 2.1 | 1.3 | 1.0 | 0.8 |
| Losses | 7 | 7 | 31.7 | 2.7 | 5.4 | 8.1 | 4.1 | 0.2 | 3.6 | 3.1 | 1.2 | 0.0 | 1.1 | |
| Month | November | 7 | 7 | 30.4 | 3.2 | 5.3 | 8.5 | 3.8 | 0.2 | 2.3 | 2.1 | 1.1 | 1.1 | 0.6 |
| December | 2 | 2 | 25.5 | 2.4 | 6.3 | 8.6 | 3.1 | 0.0 | 0.8 | 1.6 | 0.5 | 0.8 | 0.8 | |
| January | 9 | 9 | 29.2 | 5.2 | 6.1 | 11.3 | 4.0 | 0.3 | 3.2 | 2.1 | 1.5 | 0.8 | 1.2 | |
| February | 5 | 5 | 31.8 | 2.5 | 4.8 | 7.3 | 4.5 | 0.3 | 4.5 | 3.5 | 1.3 | 0.0 | 0.8 |
News Mentions

MBB | Gray Named OUA MVP, Yengue Third Team All-Star
February 28, 2018

MBB | Voyageurs Fall To Rams, Finish 4th in OUA East
February 17, 2018

MBB | Voyageurs Come Up Just Short Versus Varsity Blues
February 16, 2018

MBB | Voyageurs Outscored in Top Ten Rematch
February 10, 2018
MBB | Voyageurs Pull Away From Lakers in 4th
January 31, 2018

MBB | Voyageurs Cap Undefeated Weekend with Win Over Lions
January 27, 2018
MBB | Voyageurs Leave Little Doubt in Rematch With Gaels
January 26, 2018

MBB | Yengue Leads Laurentian to Victory
January 20, 2018
MBB | Voyageurs Comeback Falls Short In Loss to Ravens
January 19, 2018

MBB | Voyageurs Rally Over Rams
January 12, 2018

MBB | Voyageurs Take Overtime Thriller
January 6, 2018

MBB | Voyageurs Sweep Scintillating Weekend
November 25, 2017
MBB | Voyageurs Oust Gryphons, 84-71
November 24, 2017
MBB | Voyageurs take Victory Handily in Hamilton
November 17, 2017

MBB | Voyageurs Upend Golden Hawks, 106-89
November 4, 2017
MBB | Voyageurs Go 3-0 in Manitoba Match-ups
October 7, 2017