Skip to navigation
Skip to content
Skip to footer
2012-13 Basketball Statistics - Laurentian
Team Summary
| Title |
Record |
| Overall |
11-9 (.550) |
| Conference |
11-9 (.550) |
| Streak |
Lost 1 |
| Home |
7-3 |
| Away |
4-6 |
| Neutral |
0-0 |
Team Stats
| Statistics |
Overall |
Conf |
| Games |
19
|
19
|
| Points |
1537
|
1537
|
| Points per game |
80.9
|
80.9
|
| FG made per game |
28.8
|
28.8
|
| FG attempts per game |
66.1
|
66.1
|
| FG Pct |
43.7
|
43.7
|
| 3PT made per game |
8.7
|
8.7
|
| 3PT attempts per game |
26.9
|
26.9
|
| 3PT Pct |
32.4
|
32.4
|
| FT made per game |
14.5
|
14.5
|
| FT attempt per game |
18.9
|
18.9
|
| FT Pct |
76.6
|
76.6
|
| Off rebounds per game |
9.0
|
9.0
|
| Def rebounds per game |
23.2
|
23.2
|
| Total rebounds per game |
32.2
|
32.2
|
| Opponents' Off rebounds per game |
11.2
|
11.2
|
| Opponents' Def rebounds per game |
26.1
|
26.1
|
| Opponents' Total rebounds per game |
37.3
|
37.3
|
| Rebound margin per game |
-5.1
|
-5.1
|
| Assists per game |
15.4
|
15.4
|
| Opponents' Assists per game |
12.7
|
12.7
|
| Turnovers per game |
14.8
|
14.8
|
| Opponents' Turnovers per game |
16.5
|
16.5
|
| Steals per game |
7.7
|
7.7
|
| Opponents' Steals per game |
9.0
|
9.0
|
| Blocks per game |
3.3
|
3.3
|
| Opponents' Blocks per game |
2.0
|
2.0
|
| Personal fouls per game |
18.4
|
18.4
|
| Offensive efficiency |
0.995
|
0.995
|
| Net efficiency |
0.015
|
0.015
|
| Opponents' Personal fouls per game |
17.6
|
17.6
|
| Offensive efficiency |
0.980
|
0.980
|
| Points per game allowed |
79.2
|
79.2
|
| Opponents' Field goal percentage |
43.9
|
43.9
|
| Opponents' Free throw total-attempts |
35.4
|
35.4
|
| Home Attendance |
4,750
|
4,750
|
| Home Attendance average |
528
|
528
|
| Field goal total-attempts |
548-1255
|
548-1255
|
| 3 point total-attempts |
166-512
|
166-512
|
| Free throw total-attempts |
275-359
|
275-359
|
| Opponents' Field goal total-attempts |
542-1236
|
542-1236
|
| Opponents' 3 point total-attempts |
136-384
|
136-384
|
Shooting
played in 60% of team games
| # |
Name |
Yr |
Pos |
gp
|
gs
|
min/g
|
fg/g
|
pct
|
3pt/g
|
pct
|
ft/g
|
pct
|
ppg
|
| 32 |
Nelson
Yengue
|
|
SG
|
19
|
18
|
24.4
|
3.8-6.6
|
58.4
|
0.0-0.0
|
-
|
1.6-2.3
|
69.8
|
9.3
|
| 45 |
Georges
Serresse
|
|
SG
|
20
|
20
|
31.8
|
5.5-13.2
|
41.8
|
2.2-6.4
|
34.4
|
2.5-3.1
|
81.0
|
15.8
|
| 15 |
Tychon
Carter-Newman
|
|
SG
|
20
|
3
|
20.3
|
1.9-3.5
|
52.1
|
0.0-0.1
|
0.0
|
0.8-1.6
|
46.9
|
4.5
|
| 24 |
Jamie
Weldon
|
|
F
|
20
|
2
|
15.8
|
1.2-3.5
|
35.2
|
0.5-1.7
|
26.5
|
1.6-1.8
|
88.6
|
4.5
|
| 10 |
Josh
Budd
|
|
G
|
18
|
18
|
24.8
|
2.7-6.5
|
41.0
|
0.8-2.7
|
31.3
|
1.0-1.3
|
75.0
|
7.2
|
| 55 |
Alex
Ratte
|
|
SG
|
20
|
20
|
31.6
|
8.1-16.9
|
47.5
|
1.6-4.8
|
33.7
|
3.1-4.0
|
77.8
|
20.9
|
| 12 |
Manny
Pasquale
|
|
PG
|
19
|
18
|
34.3
|
5.3-13.8
|
38.4
|
3.2-9.4
|
34.1
|
3.1-3.2
|
96.7
|
16.9
|
| 22 |
Andrew
Lalonde
|
|
PG
|
15
|
-
|
12.1
|
0.2-0.9
|
23.1
|
0.0-0.3
|
0.0
|
0.1-0.5
|
25.0
|
0.5
|
| 44 |
Sam
Hirst
|
|
F
|
11
|
-
|
5.6
|
0.3-0.7
|
37.5
|
0.0-0.1
|
0.0
|
0.7-0.9
|
80.0
|
1.3
|
| 14 |
Ryan
Bennett
|
|
G
|
14
|
-
|
7.4
|
1.1-2.8
|
38.5
|
0.9-2.2
|
38.7
|
0.4-0.6
|
55.6
|
3.4
|
| 11 |
Thomas
Chalmers
|
|
G
|
7
|
1
|
4.6
|
0.0-0.4
|
0.0
|
0.0-0.1
|
0.0
|
0.3-0.6
|
50.0
|
0.3
|
| 21 |
Kris
Faucon
|
|
G
|
4
|
-
|
4.5
|
0.2-1.2
|
20.0
|
0.2-1.2
|
20.0
|
0.0-0.0
|
-
|
0.8
|
| 35 |
Stephen
Williams
|
|
SG
|
5
|
-
|
2.2
|
0.2-1.2
|
16.7
|
0.2-1.0
|
20.0
|
0.0-0.0
|
-
|
0.6
|
| Totals |
| | 19 |
19 |
199.6 |
28.8-66.1 |
43.7 |
8.7-26.9 |
32.4 |
14.5-18.9 |
76.6 |
80.9 |
| Opponent |
| | 19 |
19 |
199.6 |
28.5-65.1 |
43.9 |
7.2-20.2 |
35.4 |
15.0-20.9 |
71.8 |
79.2 |
Ball control
played in 60% of team games
| # |
Name |
Yr |
Pos |
gp
|
gs
|
mpg
|
off/g
|
def/g
|
reb/g
|
pf/g
|
dq/g
|
ast/g
|
to/g
|
a/to
|
stl/g
|
blk/g
|
| 32 |
Nelson
Yengue
|
|
SG
|
19
|
18
|
24.4
|
2.3
|
2.3
|
4.6
|
2.3
|
0.1
|
0.8
|
1.3
|
0.6
|
0.8
|
1.2
|
| 45 |
Georges
Serresse
|
|
SG
|
20
|
20
|
31.8
|
1.6
|
4.9
|
6.5
|
2.3
|
0.1
|
1.9
|
2.2
|
0.9
|
1.4
|
0.5
|
| 15 |
Tychon
Carter-Newman
|
|
SG
|
20
|
3
|
20.3
|
1.2
|
2.7
|
3.9
|
3.3
|
0.1
|
1.4
|
1.1
|
1.2
|
0.8
|
0.9
|
| 24 |
Jamie
Weldon
|
|
F
|
20
|
2
|
15.8
|
1.1
|
2.3
|
3.4
|
1.3
|
0.0
|
0.6
|
0.5
|
1.3
|
0.5
|
0.1
|
| 10 |
Josh
Budd
|
|
G
|
18
|
18
|
24.8
|
1.0
|
2.8
|
3.8
|
2.1
|
0.1
|
1.9
|
1.3
|
1.5
|
1.4
|
0.2
|
| 55 |
Alex
Ratte
|
|
SG
|
20
|
20
|
31.6
|
0.9
|
3.5
|
4.5
|
3.0
|
0.0
|
2.5
|
3.3
|
0.8
|
0.9
|
0.3
|
| 12 |
Manny
Pasquale
|
|
PG
|
19
|
18
|
34.3
|
0.6
|
2.9
|
3.5
|
2.0
|
0.0
|
4.7
|
3.5
|
1.3
|
1.7
|
0.2
|
| 22 |
Andrew
Lalonde
|
|
PG
|
15
|
-
|
12.1
|
0.2
|
1.2
|
1.4
|
1.2
|
0.0
|
2.5
|
2.1
|
1.2
|
0.5
|
0.1
|
| 44 |
Sam
Hirst
|
|
F
|
11
|
-
|
5.6
|
0.2
|
0.5
|
0.7
|
0.8
|
0.0
|
0.2
|
0.4
|
0.5
|
0.1
|
0.0
|
| 14 |
Ryan
Bennett
|
|
G
|
14
|
-
|
7.4
|
0.1
|
0.6
|
0.8
|
1.1
|
0.0
|
0.1
|
0.2
|
0.3
|
0.1
|
0.1
|
| 11 |
Thomas
Chalmers
|
|
G
|
7
|
1
|
4.6
|
0.1
|
0.3
|
0.4
|
0.0
|
0.0
|
0.3
|
0.3
|
1.0
|
0.0
|
0.0
|
| 21 |
Kris
Faucon
|
|
G
|
4
|
-
|
4.5
|
0.0
|
0.0
|
0.0
|
0.5
|
0.0
|
1.0
|
0.3
|
4.0
|
0.3
|
0.0
|
| 35 |
Stephen
Williams
|
|
SG
|
5
|
-
|
2.2
|
0.0
|
0.2
|
0.2
|
0.4
|
0.0
|
0.0
|
0.0
|
-
|
0.0
|
0.0
|
| Totals |
| | 19 |
19 |
199.6 |
9.0 |
23.2 |
32.2 |
18.4 |
- |
15.4 |
14.8 |
1.0 |
7.7 |
3.3 |
| Opponent |
| | 19 |
19 |
199.6 |
11.2 |
26.1 |
37.3 |
17.6 |
- |
12.7 |
16.5 |
0.8 |
9.0 |
2.0 |
Shooting
played in 60% of team games
| # |
Name |
Yr |
Pos |
gp
|
gs
|
min
|
fg
|
pct
|
3pt
|
pct
|
ft
|
pct
|
pts
|
| 32 |
Nelson
Yengue
|
|
SG
|
19
|
18
|
464
|
73-125
|
58.4
|
0-0
|
-
|
30-43
|
69.8
|
176
|
| 45 |
Georges
Serresse
|
|
SG
|
20
|
20
|
636
|
110-263
|
41.8
|
44-128
|
34.4
|
51-63
|
81.0
|
315
|
| 15 |
Tychon
Carter-Newman
|
|
SG
|
20
|
3
|
405
|
37-71
|
52.1
|
0-2
|
0.0
|
15-32
|
46.9
|
89
|
| 24 |
Jamie
Weldon
|
|
F
|
20
|
2
|
317
|
25-71
|
35.2
|
9-34
|
26.5
|
31-35
|
88.6
|
90
|
| 10 |
Josh
Budd
|
|
G
|
18
|
18
|
447
|
48-117
|
41.0
|
15-48
|
31.3
|
18-24
|
75.0
|
129
|
| 55 |
Alex
Ratte
|
|
SG
|
20
|
20
|
631
|
161-339
|
47.5
|
32-95
|
33.7
|
63-81
|
77.8
|
417
|
| 12 |
Manny
Pasquale
|
|
PG
|
19
|
18
|
651
|
101-263
|
38.4
|
61-179
|
34.1
|
58-60
|
96.7
|
321
|
| 22 |
Andrew
Lalonde
|
|
PG
|
15
|
-
|
181
|
3-13
|
23.1
|
0-4
|
0.0
|
2-8
|
25.0
|
8
|
| 44 |
Sam
Hirst
|
|
F
|
11
|
-
|
62
|
3-8
|
37.5
|
0-1
|
0.0
|
8-10
|
80.0
|
14
|
| 14 |
Ryan
Bennett
|
|
G
|
14
|
-
|
103
|
15-39
|
38.5
|
12-31
|
38.7
|
5-9
|
55.6
|
47
|
| 11 |
Thomas
Chalmers
|
|
G
|
7
|
1
|
32
|
0-3
|
0.0
|
0-1
|
0.0
|
2-4
|
50.0
|
2
|
| 21 |
Kris
Faucon
|
|
G
|
4
|
-
|
18
|
1-5
|
20.0
|
1-5
|
20.0
|
0-0
|
-
|
3
|
| 35 |
Stephen
Williams
|
|
SG
|
5
|
-
|
11
|
1-6
|
16.7
|
1-5
|
20.0
|
0-0
|
-
|
3
|
| Totals |
| | 19 |
19 |
3792 |
548-1255 |
43.7 |
166-512 |
32.4 |
275-359 |
76.6 |
1537 |
| Opponent |
| | 19 |
19 |
3792 |
542-1236 |
43.9 |
136-384 |
35.4 |
285-397 |
71.8 |
1505 |
Shooting
played in 60% of team games
| # |
Name |
Yr |
Pos |
gp
|
gs
|
min/g
|
fg/40
|
pct
|
3pt/40
|
pct
|
ft/40
|
pct
|
pts/40
|
| 32 |
Nelson
Yengue
|
|
SG
|
19
|
18
|
24.4
|
6.3-10.8
|
58.4
|
0.0-0.0
|
-
|
2.6-3.7
|
69.8
|
15.2
|
| 45 |
Georges
Serresse
|
|
SG
|
20
|
20
|
31.8
|
6.9-16.5
|
41.8
|
2.8-8.1
|
34.4
|
3.2-4.0
|
81.0
|
19.8
|
| 15 |
Tychon
Carter-Newman
|
|
SG
|
20
|
3
|
20.3
|
3.7-7.0
|
52.1
|
0.0-0.2
|
0.0
|
1.5-3.2
|
46.9
|
8.8
|
| 24 |
Jamie
Weldon
|
|
F
|
20
|
2
|
15.8
|
3.2-9.0
|
35.2
|
1.1-4.3
|
26.5
|
3.9-4.4
|
88.6
|
11.4
|
| 10 |
Josh
Budd
|
|
G
|
18
|
18
|
24.8
|
4.3-10.5
|
41.0
|
1.3-4.3
|
31.3
|
1.6-2.1
|
75.0
|
11.5
|
| 55 |
Alex
Ratte
|
|
SG
|
20
|
20
|
31.6
|
10.2-21.5
|
47.5
|
2.0-6.0
|
33.7
|
4.0-5.1
|
77.8
|
26.4
|
| 12 |
Manny
Pasquale
|
|
PG
|
19
|
18
|
34.3
|
6.2-16.2
|
38.4
|
3.7-11.0
|
34.1
|
3.6-3.7
|
96.7
|
19.7
|
| 22 |
Andrew
Lalonde
|
|
PG
|
15
|
-
|
12.1
|
0.7-2.9
|
23.1
|
0.0-0.9
|
0.0
|
0.4-1.8
|
25.0
|
1.8
|
| 44 |
Sam
Hirst
|
|
F
|
11
|
-
|
5.6
|
1.9-5.2
|
37.5
|
0.0-0.6
|
0.0
|
5.2-6.5
|
80.0
|
9.0
|
| 14 |
Ryan
Bennett
|
|
G
|
14
|
-
|
7.4
|
5.8-15.1
|
38.5
|
4.7-12.0
|
38.7
|
1.9-3.5
|
55.6
|
18.3
|
| 11 |
Thomas
Chalmers
|
|
G
|
7
|
1
|
4.6
|
0.0-3.8
|
0.0
|
0.0-1.2
|
0.0
|
2.5-5.0
|
50.0
|
2.5
|
| 21 |
Kris
Faucon
|
|
G
|
4
|
-
|
4.5
|
2.2-11.1
|
20.0
|
2.2-11.1
|
20.0
|
0.0-0.0
|
-
|
6.7
|
| 35 |
Stephen
Williams
|
|
SG
|
5
|
-
|
2.2
|
3.6-21.8
|
16.7
|
3.6-18.2
|
20.0
|
0.0-0.0
|
-
|
10.9
|
| Totals |
| | 19 |
19 |
199.6 |
28.9-66.2 |
43.7 |
8.8-27.0 |
32.4 |
14.5-18.9 |
76.6 |
81.1 |
| Opponent |
| | 19 |
19 |
199.6 |
28.6-65.2 |
43.9 |
7.2-20.3 |
35.4 |
15.0-20.9 |
71.8 |
79.4 |
Shooting
played in 60% of team games
| # |
Name |
Yr |
Pos |
gp
|
gs
|
min/g
|
fg/g
|
pct
|
3pt/g
|
pct
|
ft/g
|
pct
|
ppg
|
| 32 |
Nelson
Yengue
|
|
SG
|
19
|
18
|
24.4
|
3.8-6.6
|
58.4
|
0.0-0.0
|
-
|
1.6-2.3
|
69.8
|
9.3
|
| 45 |
Georges
Serresse
|
|
SG
|
20
|
20
|
31.8
|
5.5-13.2
|
41.8
|
2.2-6.4
|
34.4
|
2.5-3.1
|
81.0
|
15.8
|
| 15 |
Tychon
Carter-Newman
|
|
SG
|
20
|
3
|
20.3
|
1.9-3.5
|
52.1
|
0.0-0.1
|
0.0
|
0.8-1.6
|
46.9
|
4.5
|
| 24 |
Jamie
Weldon
|
|
F
|
20
|
2
|
15.8
|
1.2-3.5
|
35.2
|
0.5-1.7
|
26.5
|
1.6-1.8
|
88.6
|
4.5
|
| 10 |
Josh
Budd
|
|
G
|
18
|
18
|
24.8
|
2.7-6.5
|
41.0
|
0.8-2.7
|
31.3
|
1.0-1.3
|
75.0
|
7.2
|
| 55 |
Alex
Ratte
|
|
SG
|
20
|
20
|
31.6
|
8.1-16.9
|
47.5
|
1.6-4.8
|
33.7
|
3.1-4.0
|
77.8
|
20.9
|
| 12 |
Manny
Pasquale
|
|
PG
|
19
|
18
|
34.3
|
5.3-13.8
|
38.4
|
3.2-9.4
|
34.1
|
3.1-3.2
|
96.7
|
16.9
|
| 22 |
Andrew
Lalonde
|
|
PG
|
15
|
-
|
12.1
|
0.2-0.9
|
23.1
|
0.0-0.3
|
0.0
|
0.1-0.5
|
25.0
|
0.5
|
| 44 |
Sam
Hirst
|
|
F
|
11
|
-
|
5.6
|
0.3-0.7
|
37.5
|
0.0-0.1
|
0.0
|
0.7-0.9
|
80.0
|
1.3
|
| 14 |
Ryan
Bennett
|
|
G
|
14
|
-
|
7.4
|
1.1-2.8
|
38.5
|
0.9-2.2
|
38.7
|
0.4-0.6
|
55.6
|
3.4
|
| 11 |
Thomas
Chalmers
|
|
G
|
7
|
1
|
4.6
|
0.0-0.4
|
0.0
|
0.0-0.1
|
0.0
|
0.3-0.6
|
50.0
|
0.3
|
| 21 |
Kris
Faucon
|
|
G
|
4
|
-
|
4.5
|
0.2-1.2
|
20.0
|
0.2-1.2
|
20.0
|
0.0-0.0
|
-
|
0.8
|
| 35 |
Stephen
Williams
|
|
SG
|
5
|
-
|
2.2
|
0.2-1.2
|
16.7
|
0.2-1.0
|
20.0
|
0.0-0.0
|
-
|
0.6
|
| Totals |
| | 19 |
19 |
199.6 |
28.8-66.1 |
43.7 |
8.7-26.9 |
32.4 |
14.5-18.9 |
76.6 |
80.9 |
| Opponent |
| | 19 |
19 |
199.6 |
28.5-65.1 |
43.9 |
7.2-20.2 |
35.4 |
15.0-20.9 |
71.8 |
79.2 |
Ball control
played in 60% of team games
| # |
Name |
Yr |
Pos |
gp
|
gs
|
mpg
|
off/g
|
def/g
|
reb/g
|
pf/g
|
dq/g
|
ast/g
|
to/g
|
a/to
|
stl/g
|
blk/g
|
| 32 |
Nelson
Yengue
|
|
SG
|
19
|
18
|
24.4
|
2.3
|
2.3
|
4.6
|
2.3
|
0.1
|
0.8
|
1.3
|
0.6
|
0.8
|
1.2
|
| 45 |
Georges
Serresse
|
|
SG
|
20
|
20
|
31.8
|
1.6
|
4.9
|
6.5
|
2.3
|
0.1
|
1.9
|
2.2
|
0.9
|
1.4
|
0.5
|
| 15 |
Tychon
Carter-Newman
|
|
SG
|
20
|
3
|
20.3
|
1.2
|
2.7
|
3.9
|
3.3
|
0.1
|
1.4
|
1.1
|
1.2
|
0.8
|
0.9
|
| 24 |
Jamie
Weldon
|
|
F
|
20
|
2
|
15.8
|
1.1
|
2.3
|
3.4
|
1.3
|
0.0
|
0.6
|
0.5
|
1.3
|
0.5
|
0.1
|
| 10 |
Josh
Budd
|
|
G
|
18
|
18
|
24.8
|
1.0
|
2.8
|
3.8
|
2.1
|
0.1
|
1.9
|
1.3
|
1.5
|
1.4
|
0.2
|
| 55 |
Alex
Ratte
|
|
SG
|
20
|
20
|
31.6
|
0.9
|
3.5
|
4.5
|
3.0
|
0.0
|
2.5
|
3.3
|
0.8
|
0.9
|
0.3
|
| 12 |
Manny
Pasquale
|
|
PG
|
19
|
18
|
34.3
|
0.6
|
2.9
|
3.5
|
2.0
|
0.0
|
4.7
|
3.5
|
1.3
|
1.7
|
0.2
|
| 22 |
Andrew
Lalonde
|
|
PG
|
15
|
-
|
12.1
|
0.2
|
1.2
|
1.4
|
1.2
|
0.0
|
2.5
|
2.1
|
1.2
|
0.5
|
0.1
|
| 44 |
Sam
Hirst
|
|
F
|
11
|
-
|
5.6
|
0.2
|
0.5
|
0.7
|
0.8
|
0.0
|
0.2
|
0.4
|
0.5
|
0.1
|
0.0
|
| 14 |
Ryan
Bennett
|
|
G
|
14
|
-
|
7.4
|
0.1
|
0.6
|
0.8
|
1.1
|
0.0
|
0.1
|
0.2
|
0.3
|
0.1
|
0.1
|
| 11 |
Thomas
Chalmers
|
|
G
|
7
|
1
|
4.6
|
0.1
|
0.3
|
0.4
|
0.0
|
0.0
|
0.3
|
0.3
|
1.0
|
0.0
|
0.0
|
| 21 |
Kris
Faucon
|
|
G
|
4
|
-
|
4.5
|
0.0
|
0.0
|
0.0
|
0.5
|
0.0
|
1.0
|
0.3
|
4.0
|
0.3
|
0.0
|
| 35 |
Stephen
Williams
|
|
SG
|
5
|
-
|
2.2
|
0.0
|
0.2
|
0.2
|
0.4
|
0.0
|
0.0
|
0.0
|
-
|
0.0
|
0.0
|
| Totals |
| | 19 |
19 |
199.6 |
9.0 |
23.2 |
32.2 |
18.4 |
- |
15.4 |
14.8 |
1.0 |
7.7 |
3.3 |
| Opponent |
| | 19 |
19 |
199.6 |
11.2 |
26.1 |
37.3 |
17.6 |
- |
12.7 |
16.5 |
0.8 |
9.0 |
2.0 |
Shooting
played in 60% of team games
| # |
Name |
Yr |
Pos |
gp
|
gs
|
min
|
fg
|
pct
|
3pt
|
pct
|
ft
|
pct
|
pts
|
| 32 |
Nelson
Yengue
|
|
SG
|
19
|
18
|
464
|
73-125
|
58.4
|
0-0
|
-
|
30-43
|
69.8
|
176
|
| 45 |
Georges
Serresse
|
|
SG
|
20
|
20
|
636
|
110-263
|
41.8
|
44-128
|
34.4
|
51-63
|
81.0
|
315
|
| 15 |
Tychon
Carter-Newman
|
|
SG
|
20
|
3
|
405
|
37-71
|
52.1
|
0-2
|
0.0
|
15-32
|
46.9
|
89
|
| 24 |
Jamie
Weldon
|
|
F
|
20
|
2
|
317
|
25-71
|
35.2
|
9-34
|
26.5
|
31-35
|
88.6
|
90
|
| 10 |
Josh
Budd
|
|
G
|
18
|
18
|
447
|
48-117
|
41.0
|
15-48
|
31.3
|
18-24
|
75.0
|
129
|
| 55 |
Alex
Ratte
|
|
SG
|
20
|
20
|
631
|
161-339
|
47.5
|
32-95
|
33.7
|
63-81
|
77.8
|
417
|
| 12 |
Manny
Pasquale
|
|
PG
|
19
|
18
|
651
|
101-263
|
38.4
|
61-179
|
34.1
|
58-60
|
96.7
|
321
|
| 22 |
Andrew
Lalonde
|
|
PG
|
15
|
-
|
181
|
3-13
|
23.1
|
0-4
|
0.0
|
2-8
|
25.0
|
8
|
| 44 |
Sam
Hirst
|
|
F
|
11
|
-
|
62
|
3-8
|
37.5
|
0-1
|
0.0
|
8-10
|
80.0
|
14
|
| 14 |
Ryan
Bennett
|
|
G
|
14
|
-
|
103
|
15-39
|
38.5
|
12-31
|
38.7
|
5-9
|
55.6
|
47
|
| 11 |
Thomas
Chalmers
|
|
G
|
7
|
1
|
32
|
0-3
|
0.0
|
0-1
|
0.0
|
2-4
|
50.0
|
2
|
| 21 |
Kris
Faucon
|
|
G
|
4
|
-
|
18
|
1-5
|
20.0
|
1-5
|
20.0
|
0-0
|
-
|
3
|
| 35 |
Stephen
Williams
|
|
SG
|
5
|
-
|
11
|
1-6
|
16.7
|
1-5
|
20.0
|
0-0
|
-
|
3
|
| Totals |
| | 19 |
19 |
3792 |
548-1255 |
43.7 |
166-512 |
32.4 |
275-359 |
76.6 |
1537 |
| Opponent |
| | 19 |
19 |
3792 |
542-1236 |
43.9 |
136-384 |
35.4 |
285-397 |
71.8 |
1505 |
Shooting
played in 60% of team games
| # |
Name |
Yr |
Pos |
gp
|
gs
|
min/g
|
fg/40
|
pct
|
3pt/40
|
pct
|
ft/40
|
pct
|
pts/40
|
| 32 |
Nelson
Yengue
|
|
SG
|
19
|
18
|
24.4
|
6.3-10.8
|
58.4
|
0.0-0.0
|
-
|
2.6-3.7
|
69.8
|
15.2
|
| 45 |
Georges
Serresse
|
|
SG
|
20
|
20
|
31.8
|
6.9-16.5
|
41.8
|
2.8-8.1
|
34.4
|
3.2-4.0
|
81.0
|
19.8
|
| 15 |
Tychon
Carter-Newman
|
|
SG
|
20
|
3
|
20.3
|
3.7-7.0
|
52.1
|
0.0-0.2
|
0.0
|
1.5-3.2
|
46.9
|
8.8
|
| 24 |
Jamie
Weldon
|
|
F
|
20
|
2
|
15.8
|
3.2-9.0
|
35.2
|
1.1-4.3
|
26.5
|
3.9-4.4
|
88.6
|
11.4
|
| 10 |
Josh
Budd
|
|
G
|
18
|
18
|
24.8
|
4.3-10.5
|
41.0
|
1.3-4.3
|
31.3
|
1.6-2.1
|
75.0
|
11.5
|
| 55 |
Alex
Ratte
|
|
SG
|
20
|
20
|
31.6
|
10.2-21.5
|
47.5
|
2.0-6.0
|
33.7
|
4.0-5.1
|
77.8
|
26.4
|
| 12 |
Manny
Pasquale
|
|
PG
|
19
|
18
|
34.3
|
6.2-16.2
|
38.4
|
3.7-11.0
|
34.1
|
3.6-3.7
|
96.7
|
19.7
|
| 22 |
Andrew
Lalonde
|
|
PG
|
15
|
-
|
12.1
|
0.7-2.9
|
23.1
|
0.0-0.9
|
0.0
|
0.4-1.8
|
25.0
|
1.8
|
| 44 |
Sam
Hirst
|
|
F
|
11
|
-
|
5.6
|
1.9-5.2
|
37.5
|
0.0-0.6
|
0.0
|
5.2-6.5
|
80.0
|
9.0
|
| 14 |
Ryan
Bennett
|
|
G
|
14
|
-
|
7.4
|
5.8-15.1
|
38.5
|
4.7-12.0
|
38.7
|
1.9-3.5
|
55.6
|
18.3
|
| 11 |
Thomas
Chalmers
|
|
G
|
7
|
1
|
4.6
|
0.0-3.8
|
0.0
|
0.0-1.2
|
0.0
|
2.5-5.0
|
50.0
|
2.5
|
| 21 |
Kris
Faucon
|
|
G
|
4
|
-
|
4.5
|
2.2-11.1
|
20.0
|
2.2-11.1
|
20.0
|
0.0-0.0
|
-
|
6.7
|
| 35 |
Stephen
Williams
|
|
SG
|
5
|
-
|
2.2
|
3.6-21.8
|
16.7
|
3.6-18.2
|
20.0
|
0.0-0.0
|
-
|
10.9
|
| Totals |
| | 19 |
19 |
199.6 |
28.9-66.2 |
43.7 |
8.8-27.0 |
32.4 |
14.5-18.9 |
76.6 |
81.1 |
| Opponent |
| | 19 |
19 |
199.6 |
28.6-65.2 |
43.9 |
7.2-20.3 |
35.4 |
15.0-20.9 |
71.8 |
79.4 |
Download roster:
BRO (First Last) |
BRO (Last, First)
| Date |
Opponent |
Score |
fg |
pct |
3pt |
pct |
ft |
pct |
off |
def |
reb |
ast |
to |
stl |
blk |
pf |
pts |
|
Oct 6
#
|
vs. Concordia
|
L, 85-82
|
- |
- |
- |
- |
- |
- |
- |
- |
- |
- |
- |
- |
- |
- |
- |
|
Oct 19
#
|
vs. Memorial
|
W, 109-35
|
- |
- |
- |
- |
- |
- |
- |
- |
- |
- |
- |
- |
- |
- |
- |
|
Oct 20
#
|
vs. UQAM
|
W, 78-58
|
- |
- |
- |
- |
- |
- |
- |
- |
- |
- |
- |
- |
- |
- |
- |
|
Oct 21
#
|
vs. Waterloo
|
W, 80-66
|
- |
- |
- |
- |
- |
- |
- |
- |
- |
- |
- |
- |
- |
- |
- |
|
Nov 9
|
at Brock
|
L, 93-88
|
34-75 |
45.3 |
8-29 |
27.6 |
12-14 |
85.7 |
10 |
25 |
35 |
20 |
15 |
9 |
3 |
20 |
88 |
|
Nov 10
|
at McMaster
|
W, 65-64
|
24-56 |
42.9 |
8-25 |
32.0 |
9-13 |
69.2 |
5 |
23 |
28 |
13 |
23 |
10 |
1 |
20 |
65 |
|
Nov 16
|
Windsor
|
W, 80-72
|
27-66 |
40.9 |
9-25 |
36.0 |
17-22 |
77.3 |
10 |
22 |
32 |
17 |
17 |
9 |
5 |
21 |
80 |
|
Nov 17
|
Western
|
W, 75-65
|
27-60 |
45.0 |
9-29 |
31.0 |
12-16 |
75.0 |
8 |
22 |
30 |
23 |
8 |
10 |
4 |
17 |
75 |
|
Nov 23
|
Waterloo
|
W, 78-55
|
30-59 |
50.8 |
6-19 |
31.6 |
12-15 |
80.0 |
6 |
28 |
34 |
18 |
10 |
8 |
2 |
9 |
78 |
|
Nov 24
|
Laurier
|
W, 92-63
|
34-79 |
43.0 |
8-32 |
25.0 |
16-24 |
66.7 |
13 |
31 |
44 |
17 |
8 |
13 |
5 |
19 |
92 |
|
Nov 30
|
at Lakehead
|
L, 90-71
|
27-60 |
45.0 |
7-19 |
36.8 |
10-10 |
100.0 |
6 |
17 |
23 |
17 |
15 |
2 |
7 |
21 |
71 |
|
Dec 1
|
at Guelph
|
L, 88-78
|
28-64 |
43.8 |
8-28 |
28.6 |
14-22 |
63.6 |
9 |
21 |
30 |
10 |
13 |
5 |
0 |
28 |
78 |
|
Dec 30
#
|
Cape Breton
|
L, 71-64
|
26-76 |
34.2 |
10-33 |
30.3 |
2-7 |
28.6 |
12 |
28 |
40 |
14 |
13 |
14 |
0 |
15 |
64 |
|
Jan 4
|
Carleton
|
L, 81-57
|
16-56 |
28.6 |
4-16 |
25.0 |
21-29 |
72.4 |
6 |
19 |
25 |
13 |
13 |
3 |
7 |
25 |
57 |
|
Jan 5
|
Ottawa
|
L, 87-77
|
- |
- |
- |
- |
- |
- |
- |
- |
- |
- |
- |
- |
- |
- |
- |
|
Jan 12
|
at Queen's
|
L, 84-82
|
30-71 |
42.3 |
11-37 |
29.7 |
11-16 |
68.8 |
8 |
23 |
31 |
14 |
17 |
9 |
6 |
15 |
82 |
|
Jan 18
|
Ryerson
|
W, 75-73
|
26-69 |
37.7 |
7-26 |
26.9 |
16-23 |
69.6 |
13 |
24 |
37 |
16 |
10 |
5 |
3 |
14 |
75 |
|
Jan 19
|
Toronto
|
W, 98-78
|
32-75 |
42.7 |
12-37 |
32.4 |
22-29 |
75.9 |
12 |
29 |
41 |
16 |
11 |
11 |
2 |
18 |
98 |
|
Jan 25
|
at Ottawa
|
W, 73-72
|
27-68 |
39.7 |
4-20 |
20.0 |
15-17 |
88.2 |
10 |
21 |
31 |
7 |
12 |
11 |
1 |
13 |
73 |
|
Jan 26
|
at Carleton
|
L, 90-66
|
24-59 |
40.7 |
8-32 |
25.0 |
10-13 |
76.9 |
8 |
20 |
28 |
6 |
15 |
5 |
1 |
16 |
66 |
|
Feb 1
|
at Toronto
|
W, 84-65
|
31-63 |
49.2 |
11-25 |
44.0 |
11-18 |
61.1 |
11 |
28 |
39 |
20 |
20 |
8 |
5 |
17 |
84 |
|
Feb 2
|
at Ryerson
|
L, 89-84
|
28-71 |
39.4 |
11-29 |
37.9 |
17-22 |
77.3 |
10 |
23 |
33 |
8 |
16 |
4 |
3 |
25 |
84 |
|
Feb 8
|
Queen's
|
W, 95-86
|
32-66 |
48.5 |
15-35 |
42.9 |
16-18 |
88.9 |
7 |
27 |
34 |
20 |
19 |
12 |
0 |
14 |
95 |
|
Feb 13
|
at York
|
W, 95-93
|
35-68 |
51.5 |
9-21 |
42.9 |
16-19 |
84.2 |
5 |
24 |
29 |
20 |
19 |
7 |
2 |
18 |
95 |
|
Feb 15
|
York
|
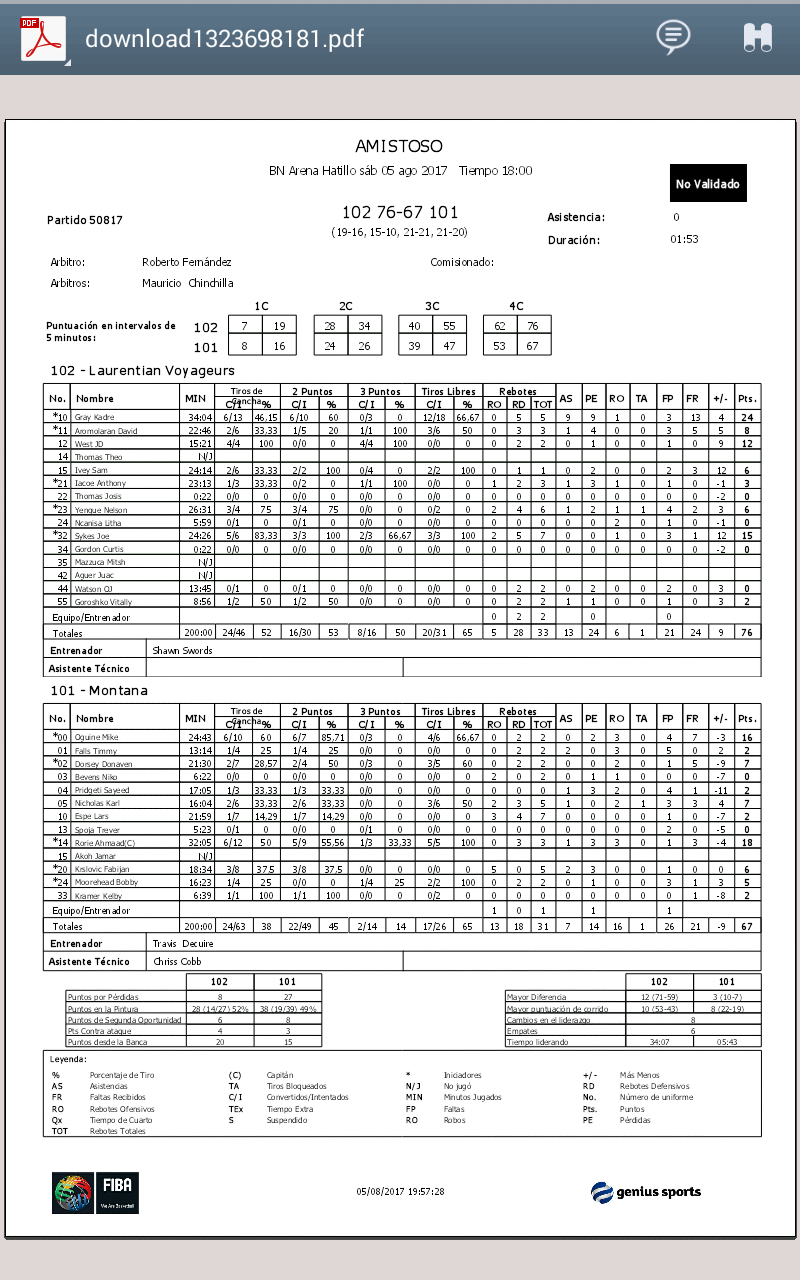
L, 104-101
|
36-70 |
51.4 |
11-28 |
39.3 |
18-19 |
94.7 |
14 |
13 |
27 |
18 |
20 |
6 |
5 |
20 |
101 |
| |
gp |
fg |
pct |
3pt |
pct |
ft |
pct |
off |
def |
reb |
ast |
to |
stl |
blk |
pf |
pts |
off eff |
net eff |
| Total |
19 |
548-1255 |
43.7 |
166-512 |
32.4 |
275-359 |
76.6 |
9.0 |
23.2 |
32.2 |
15.4 |
14.8 |
7.7 |
3.3 |
18.4 |
80.9 |
0.995 |
0.015 |
| Conference |
19 |
548-1255 |
43.7 |
166-512 |
32.4 |
275-359 |
76.6 |
9.0 |
23.2 |
32.2 |
15.4 |
14.8 |
7.7 |
3.3 |
18.4 |
80.9 |
0.995 |
0.015 |
| Exhibition |
1 |
26-76 |
34.2 |
10-33 |
30.3 |
2-7 |
28.6 |
12.0 |
28.0 |
40.0 |
14.0 |
13.0 |
14.0 |
0.0 |
15.0 |
64.0 |
0.795 |
-0.087 |
| |
| Home |
9 |
260-600 |
43.3 |
81-247 |
32.8 |
150-195 |
76.9 |
9.9 |
23.9 |
33.8 |
17.6 |
12.9 |
8.6 |
3.7 |
17.4 |
83.4 |
1.037 |
0.104 |
| Away |
10 |
288-655 |
44.0 |
85-265 |
32.1 |
125-164 |
76.2 |
8.2 |
22.5 |
30.7 |
13.5 |
16.5 |
7.0 |
2.9 |
19.3 |
78.6 |
0.959 |
-0.064 |
| Neutral |
- |
0-0 |
- |
0-0 |
- |
0-0 |
- |
- |
- |
- |
- |
- |
- |
- |
- |
- |
- |
- |
| |
| Wins |
11 |
325-729 |
44.6 |
98-294 |
33.3 |
162-214 |
75.7 |
9.1 |
25.4 |
34.5 |
17.0 |
14.3 |
9.5 |
2.7 |
16.4 |
82.7 |
1.019 |
0.129 |
| Losses |
8 |
223-526 |
42.4 |
68-218 |
31.2 |
113-145 |
77.9 |
8.9 |
20.1 |
29.0 |
13.3 |
15.5 |
5.4 |
4.0 |
21.3 |
78.4 |
0.962 |
-0.140 |
| |
| November |
7 |
203-455 |
44.6 |
55-178 |
30.9 |
88-114 |
77.2 |
8.3 |
24.0 |
32.3 |
17.9 |
13.7 |
8.7 |
3.9 |
18.1 |
78.4 |
0.998 |
0.090 |
| December |
1 |
28-64 |
43.8 |
8-28 |
28.6 |
14-22 |
63.6 |
9.0 |
21.0 |
30.0 |
10.0 |
13.0 |
5.0 |
0.0 |
28.0 |
78.0 |
0.987 |
-0.067 |
| January |
6 |
155-398 |
38.9 |
46-168 |
27.4 |
95-127 |
74.8 |
9.5 |
22.7 |
32.2 |
12.0 |
13.0 |
7.3 |
3.3 |
16.8 |
75.2 |
0.935 |
-0.080 |
| February |
5 |
162-338 |
47.9 |
57-138 |
41.3 |
78-96 |
81.3 |
9.4 |
23.0 |
32.4 |
17.2 |
18.8 |
7.4 |
3.0 |
18.8 |
91.8 |
1.060 |
0.040 |
| Date |
Opponent |
Score |
Attend |
| Oct 6 |
vs.
Concordia
|
82-85 Loss
|
- |
| Oct 19 |
vs.
Memorial
|
109-35 Win
|
- |
| Oct 20 |
vs.
UQAM
|
78-58 Win
|
- |
| Oct 21 |
vs.
Waterloo
|
80-66 Win
|
- |
| Nov 9 |
at
Brock
|
L, 93-88
|
0 |
| Nov 10 |
at
McMaster
|
W, 65-64
|
329 |
| Nov 16 |
Windsor
|
W, 80-72
|
800 |
| Nov 17 |
Western
|
W, 75-65
|
650 |
| Nov 23 |
Waterloo
|
W, 78-55
|
675 |
| Nov 24 |
Laurier
|
W, 92-63
|
550 |
| Nov 30 |
at
Lakehead
|
L, 90-71
|
0 |
| Dec 1 |
at
Guelph
|
L, 88-78
|
0 |
| Dec 30 |
Cape Breton
|
L, 71-64
|
0 |
| Jan 4 |
Carleton
|
L, 81-57
|
325 |
| Jan 5 |
Ottawa
|
77-87 Loss
|
- |
| Jan 12 |
at
Queen's
|
L, 84-82
|
0 |
| Jan 18 |
Ryerson
|
W, 75-73
|
500 |
| Jan 19 |
Toronto
|
W, 98-78
|
450 |
| Jan 25 |
at
Ottawa
|
W, 73-72
|
0 |
| Jan 26 |
at
Carleton
|
L, 90-66
|
0 |
| Feb 1 |
at
Toronto
|
W, 84-65
|
0 |
| Feb 2 |
at
Ryerson
|
L, 89-84
|
0 |
| Feb 8 |
Queen's
|
W, 95-86
|
500 |
| Feb 13 |
at
York
|
W, 95-93
|
0 |
| Feb 15 |
York
|
L, 104-101
|
300 |


